Regency Centers Corporation | REIT Profile
Symbol: REG
CIK: 910606
Exchange: NYSE
Founded: 1963 (63 years)
HQ: Jacksonville, FL, United States
Type of REIT: Equity REIT
Listing Status: Public
Market Capitalization: Large-Cap
REIT Sector: Retail
See REG on Yahoo Finance
See REG on SEC.gov
 |
 |
 |
 |
 |
 |
 |
 |
Regency Centers Corporation (NYSE: REG) is a publicly traded real estate investment trust that specializes in grocery-anchored, necessity-based retail shopping centers. The company acquires, develops, owns and operates neighborhood and community centers across the United States, emphasizing stable, long-term income from diversified tenant mixes and strong grocery and service-oriented anchors. Regency’s operating strategy centers on active asset management and selective development and redevelopment to enhance property performance and shopper traffic. The company is known for partnerships with national and regional grocers and service providers, a focus on suburban and infill markets, and efforts to maintain portfolio quality through leasing and capital investment. Regency also reports on sustainability and governance initiatives as part of its corporate disclosures. As a REIT, it distributes income to shareholders through dividends and is listed on the New York Stock Exchange under the ticker REG.

Stock Chart
REITBot™ End of Day Summary 2026-10-21
REG fell 1.34% to $72.22 on 1,100,708 shares; whether volume was above or below normal could not be established from the available results. No material company-specific news was found; the most likely driver was pressure on REITs from a sharp rise in Treasury yields, with the 10-year yield reaching about 5.35% on October 21. [web:3] Forward annualized dividend: $3.02 per share; forward dividend yield: 4.1%. REITRating™: 7.06/10.
Disclaimer: AI-generated REIT market summary currently in beta testing. Information is provided for informational purposes only and may contain inaccuracies or delays. Last update: 2026-10-21 PSTDividends
Below are the latest REG dividend details. Annualized Dividend projects the current dividend rate over a full year, while TTM Dividend shows the total dividends paid over the past 12 months. The Ex-Dividend Date is the cutoff to qualify for the next dividend, and the Dividend Date is when that payment is made.
Annualized Dividend: $3.02*
Annualized Dividend (TTM): $3.02
Dividend Date: 2026-10-02
Dividend Frequency: Quarterly
Dividend History
Below are the most recent cash dividends paid by REG. The percent difference from one dividend payment to the next has also been calculated for your convenience. Dividends flagged as [E] are extraordinary dividend payments.
| Symbol | Ex Date | Cash Amount | Change in Dividend | Declaration Date | Record Date | Payment Date |
|---|---|---|---|---|---|---|
| REG | 2026-09-11 | 0.755 | --- | 2026-08-05 | 2026-09-11 | 2026-10-02 |
| REG | 2026-06-12 | 0.755 | --- | 2026-05-06 | 2026-06-12 | 2026-07-02 |
| REG | 2026-03-11 | 0.755 | --- | 2026-02-04 | 2026-03-11 | 2026-04-01 |
| REG | 2025-12-15 | 0.755 | 7.09% | 2025-10-27 | 2025-12-15 | 2026-01-06 |
| REG | 2025-09-11 | 0.705 | --- | 2025-08-05 | 2025-09-11 | 2025-10-02 |
| REG | 2025-06-11 | 0.705 | --- | 2025-05-06 | 2025-06-11 | 2025-07-02 |
| REG | 2025-03-12 | 0.705 | --- | 2025-02-06 | 2025-03-12 | 2025-04-02 |
| REG | 2024-12-16 | 0.705 | 5.22% | 2024-11-05 | 2024-12-16 | 2025-01-03 |
| REG | 2024-09-12 | 0.670 | --- | 2024-07-31 | 2024-09-12 | 2024-10-03 |
| REG | 2024-06-12 | 0.670 | --- | 2024-05-02 | 2024-06-12 | 2024-07-03 |
| REG | 2024-03-12 | 0.670 | --- | 2024-02-07 | 2024-03-13 | 2024-04-03 |
| REG | 2023-12-13 | 0.670 | 3.08% | 2023-11-02 | 2023-12-14 | 2024-01-03 |
*The forward annualized dividend and dividend yield are based on the most recent dividend value paid by the REIT. The REIT may have already announced their next upcoming dividend value, which may be different from previously paid dividend value. It is recommended to check the REIT's website and dividend announcements for the latest information on upcoming dividends and changes.
Latest REIT Press Releases
- Sunstone Hotel Investors, Inc. - SUNSTONE HOTEL INVESTORS ENTERS INTO AN AGREEMENT TO SELL HYATT REGENCY SAN FRANCISCO - Tue, 23 Jun 2026 11:30:40 UTC
- Regency Centers Prices $450 Million Senior Unsecured Notes Offering - Wed, 18 Feb 2026 21:40:14 UTC
- Regency Centers Reports Fourth Quarter and Full Year 2025 Results - Thu, 05 Feb 2026 21:16:18 UTC
- Regency Centers Announces Tax Information for Regency Centers 2025 Distributions - Thu, 22 Jan 2026 13:16:02 UTC
- Regency Centers Elects Mark J. Parrell to Board of Directors - Tue, 16 Dec 2025 13:16:09 UTC
Funds From Operations (FFO)
FFO Amount
Below are the FFO amounts, dividends, payout ratios, and P/FFO for the last two quarters for REG. Compare FFO to other REITs at REITFFO.
| Year | Quarter | Type | Amount | Dividend Paid | Payout Ratio | Annualized P/FFO |
|---|---|---|---|---|---|---|
| 2026 | Q2 | Nareit FFO | $1.21 | $0.76 | 62.40% | 16.48x |
| 2026 | Q1 | Nareit FFO | $1.17 | $0.76 | 64.53% | 16.17x |
REITNotes uses the REIT's Funds From Operation (FFO) per diluted share informed in the REIT’s Quarterly Earning Reports and its announced dividend per diluted share. For some REITs, we also display the Adjusted Funds From Operations (AFFO), Core FFO, Normalized FFO (NFFO), Modified FFO (MFFO), Operating FFO as provided by the REIT. REITNotes™ calculates the payout ratio by dividing the dividend value paid during the current quarter by the FFO declared in the previous Quarter. E.g., we divide the dividend value paid in Q3 by the FFO reported in Q2. This is because although paid in Q3, the dividend value is usually declared during the previous quarter. FFO is a non-GAAP measure recognized by the SEC and provided by the REITs as a supplemental measure of their operating performance. FFO is not meant to be an indicator of the REIT’s capacity to pay current or future dividends nor to be a substitute to the REIT's cash flow from operations. It is recommended to check the REIT's website, Earning Reports and dividend announcements for the latest and updated information. The “Payout Ratio” is calculated by dividing the “Dividends Paid” column by the “FFO Amount” column. Some REITs may have two types of FFO (eg. FFO and Modified FFO) while others may have just one type of FFO.
Latest Key Stats
EBITDA: $1,071,215,000 [?]
P/E (Price-to-Earnings) Ratio: 24.65 [?]
PEG (Price/Earnings to Growth) Ratio: 2.70 [?]
Book Value: 36.40 [?]
Dividend Per Share (DPS): $2.97 [?]
Earnings Per Share (EPS): 2.97 [?]
Revenue Per Share (TTM): $9.23 [?]
Profit Margin: 33.00% [?]
Operating Margin (TTM): 39.60% [?]
Return on Equity (TTM): 8.20% [?]
Revenue (TTM): $1,685,532,000 [?]
Gross Profit (TTM): $1,205,810,000 [?]
Diluted EPS (TTM): $2.97 [?]
Quarterly Earnings Growth YOY: 8.90% [?]
Quarterly Revenue Growth YOY: 8.90% [?]
Trailing P/E: 24.65 [?]
Forward P/E: 28.90 [?]
Beta: 0.82 [?]
Price-to-Book (P/B): 2.00 [?]
Enterprise Value (EV) to Revenue: 11.86 [?]
EV to EBITDA: 15.95x [?]
Shares Outstanding: 183,121,000 [?]
52 Week High: $82.82 [?]
52 Week Low: $64.44 [?]
50 Day Moving Average: $74.16 [?]
200 Day Moving Average: $76.48 [?]
Properties Owned by REG
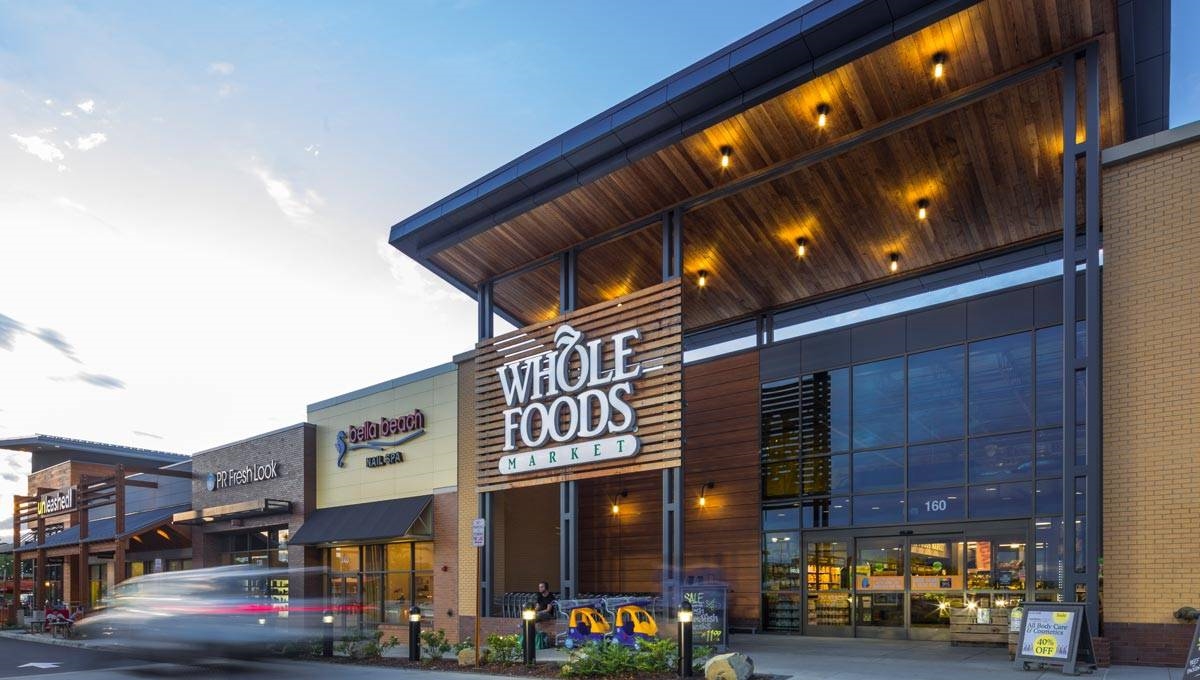
Sample of REIT’s Properties. Image Source - REIT’s website
Occupancy Rate
Below are REG’s reported occupancy rates for the two most recent quarters, allowing you to quickly track changes in portfolio occupancy over time.
| Year | Quarter | Occupancy |
|---|---|---|
| 2026 | Q2 | 94.5% |
| 2026 | Q1 | 96.6% |
Different REITs may report Occupancy levels in various forms/calculations. Some of the terms used to describe occupancy are Portfolio Occupancy, Weighted Average Occupancy, Ending Occupancy, Economic Occupancy, Leased Occupancy, Physical Occupancy, Pro Forma Occupancy, Same-Property Occupancy, Stabilized Portfolio Occupancy, Comparable Occupancy, Lease Rate, Percent Leased, among others. Some REITs interchange the words Occupancy and Leased while others use them to distinguish between data points. Some REITs also vary the use of the words over time through their earning reports. Therefore the information provided here is our best attempt at collecting data on occupancy/leased trends. However, it may not be accurate or comparable between different REITs.
REIT Simulation
Below is a simulation of how much money you would have made in dividends, and how much the shares would be worth had you purchased them 1 year ago for the amounts below.
| With $1,000 USD | With $500 USD | With $250 USD | With $100 USD | With $50 USD | |
|---|---|---|---|---|---|
| Initial investment | @ $72.48 per share you would have been able to buy 13 shares of REG on 2025-10-23 costing $942.24 | @ $72.48 per share you would have been able to buy 6 shares of REG on 2025-10-23 costing $434.88 | @ $72.48 per share you would have been able to buy 3 shares of REG on 2025-10-23 costing $217.44 | @ $72.48 per share you would have been able to buy 1 shares of REG on 2025-10-23 costing $72.48 | @ $72.48 per share you would have been able to buy 0 shares of REG on 2025-10-23 costing $0.00 |
| Current worth | On 2026-10-22 these 13 shares would be worth $966.94 @ $74.38 | On 2026-10-22 these 6 shares would be worth $446.28 @ $74.38 | On 2026-10-22 these 3 shares would be worth $223.14 @ $74.38 | On 2026-10-22 these 1 shares would be worth $74.38 @ $74.38 | On 2026-10-22 these 0 shares would be worth $0.00 @ $74.38 |
| Dividends earned | $39.26 in dividends would have been earned since 2025-10-23 with 13 shares. | $18 in dividends would have been earned since 2025-10-23 with 6 shares. | $9.06 in dividends would have been earned since 2025-10-23 with 3 shares. | $3.02 in dividends would have been earned since 2025-10-23 with 1 shares. | $0.00 in dividends would have been earned since 2025-10-23 with 6 shares. |
| Net (gain / loss)* | 63.96 USD | 29.52 USD | 14.76 USD | 4.92 USD | 0.00 USD |
| ROI** | 6.79% | 6.79% | 6.79% | 6.79% | 0.00% |
*Net (Gains/Loss): Includes the stock price (appreciate or depreciate ) + dividends earned during period held. Stock prices based on closing price for the date. **ROI: Is based on the Net (gain/loss) divided by the initial investment value. Note: Past performance is no guarantee of future results. This is a high-level simulation and does not account for many factors such as inflation and taxes so we cannot guarantee the accuracy of this simulation.
Financial Statements Overview
Balance Sheet | Quarterly
| Assets | 2026-06-30 | 2026-03-31 | QoQ |
|---|---|---|---|
| Current Assets | |||
| Cash and Cash Equivalents at Carrying Value | 191,614,000 | 145,560,000 | |
| Short-Term Investments | 0 | 0 | |
| Cash and Short Term Investments | 191,614,000 | 145,560,000 | |
| Current Net Receivables | 291,660,000 | 267,639,000 | |
| Inventory | 0 | 0 | |
| Other Current Assets | 0 | 0 | |
| Total Current Assets | 483,274,000 | 413,199,000 | 17.0% |
| Non-Current Assets | |||
| Property Plant Equipment | 0 | 0 | |
| Accumulated Depreciation Amortization PPE | 0 | 0 | |
| Long-Term Investments | 0 | 0 | |
| Investments | 0 | 0 | |
| Intangible Assets Excluding Goodwill | 233,561,000 | 244,876,000 | |
| Goodwill | 0 | 0 | |
| Intangible Assets | 233,561,000 | 244,876,000 | |
| Other Non-Current Assets | 0 | 0 | |
| Total Non-Current Assets | 12,639,668,000 | 12,633,285,000 | 0.1% |
| Total Assets | 13,122,942,000 | 13,046,484,000 | 0.6% |
| Liabilities | |||
| Current Liabilities | |||
| Current Accounts Payable | 0 | 0 | |
| Deferred Revenue | 0 | 0 | |
| Current Debt | 0 | 0 | |
| Short-Term Debt | 166,268,000 | 269,483,000 | |
| Current Long-Term Debt | 0 | 0 | |
| Short Long-Term Debt Total | 5,489,077,000 | 5,597,148,000 | |
| Other Current Liabilities | 0 | 0 | |
| Total Current Liabilities | 166,268,000 | 269,483,000 | -38.3% |
| Non-Current Liabilities | |||
| Long-Term Debt Noncurrent | 0 | 0 | |
| Long-Term Debt | 0 | 0 | |
| Capital Lease Obligations | 0 | 0 | |
| Other Non-Current Liabilities | 0 | 0 | |
| Total Non-Current Liabilities | 5,809,486,000 | 5,612,094,000 | |
| Total Liabilities | 5,975,754,000 | 5,881,577,000 | 1.6% |
| Shareholders' Equity | |||
| Common Stock | 1,831,000 | 1,831,000 | |
| Common Stock Shares Outstanding | 183,351,000 | 183,382,000 | |
| Treasury Stock | 0 | 0 | |
| Retained Earnings | -2,027,768,000 | -2,001,870,000 | |
| Total Shareholder Equity | 6,874,951,000 | 6,892,835,000 | -0.3% |
Amounts in USD ($)