InvenTrust Properties Corp. | REIT Profile
Symbol: IVT
CIK: 1307748
Exchange: NYSE
Founded: 2014 (12 years)
HQ: Downers Grove, IL, United States
Type of REIT: Equity REIT
Listing Status: Public
Market Capitalization: Mid-Cap
REIT Sector: Retail
REITRating™ Score: 4.8
See IVT on Yahoo Finance
See IVT on SEC.gov
InvenTrust Properties Corp. (NYSE: IVT) is a publicly traded real estate investment trust that acquires, owns, develops and manages retail real estate, primarily open‑air shopping centers. The company focuses on necessity‑based, service‑oriented and experiential tenants—such as grocers, fitness, restaurants and personal services—to drive resilient traffic and stable cash flow. InvenTrust concentrates its portfolio largely in high-growth Sun Belt and select suburban markets across the United States. Its business model emphasizes active asset management and selective development or redevelopment to enhance tenant mix and property performance. As a REIT, InvenTrust distributes a portion of taxable income to shareholders and seeks to generate returns through rental income and property value appreciation. (Ticker: IVT)
Stock Chart
Dividend of Trading Day 2026-07-30
Annualized Dividend: $1*
Dividend Yield (TTM): 2.8%
Annualized Dividend (TTM): $0.975
Ex-Dividend Date: 2026-06-30
Dividend Date: 2026-07-15
Dividend Frequency: Quarterly
*The forward annualized dividend and dividend yield are based on the most recent dividend value paid by the REIT. The REIT may have already announced their next upcoming dividend value, which may be different from previously paid dividend value. It is recommended to check the REIT's website and dividend announcements for the latest information on upcoming dividends and changes. This graph does not include extraordinary dividend.
Latest REIT Press Releases
- - InvenTrust Properties Corp. Declares Second Quarter 2026 Cash Dividend - Mon, 15 Jun 2026 20:02:57 UTC
- - InvenTrust Properties Corp. Reports 2026 First Quarter Results - Tue, 28 Apr 2026 20:07:42 UTC
- - InvenTrust Properties Corp. Enters into a Private Placement Offering of $250 Million Senior Unsecured Notes - Thu, 16 Apr 2026 21:29:10 UTC
- - InvenTrust Properties Corp. Declares First Quarter 2026 Cash Dividend - Mon, 16 Mar 2026 20:06:10 UTC
- - InvenTrust Properties Corp. Reports 2025 Fourth Quarter and Full Year Results - Tue, 10 Feb 2026 21:05:48 UTC
Key Stats of Trading Day 2026-07-30
EBITDA: $177,639,000 [?]
P/E (Price-to-Earnings) Ratio: 25.91 [?]
PEG (Price/Earnings to Growth) Ratio: N/A [?]
Book Value: 22.82 [?]
Dividend Per Share (DPS): $0.96 [?]
Earnings Per Share (EPS): 1.39 [?]
Revenue Per Share (TTM): $3.96 [?]
Profit Margin: 35.70% [?]
Operating Margin (TTM): 18.10% [?]
Return on Equity (TTM): 6.20% [?]
Revenue (TTM): $307,979,000 [?]
Gross Profit (TTM): $221,816,000 [?]
Diluted EPS (TTM): $1.39 [?]
Quarterly Earnings Growth YOY: -24.00% [?]
Quarterly Revenue Growth YOY: 11.90% [?]
Trailing P/E: 25.91 [?]
Forward P/E: 250.00 [?]
Beta: -6.13 [?]
Price-to-Book (P/B): 1.58 [?]
Enterprise Value (EV) to Revenue: 12.10 [?]
EV to EBITDA: 13.29x [?]
Shares Outstanding: 77,936,000 [?]
52 Week High: $37.22 [?]
52 Week Low: $26.01 [?]
50 Day Moving Average: $34.63 [?]
200 Day Moving Average: $30.95 [?]
Properties Owned by IVT
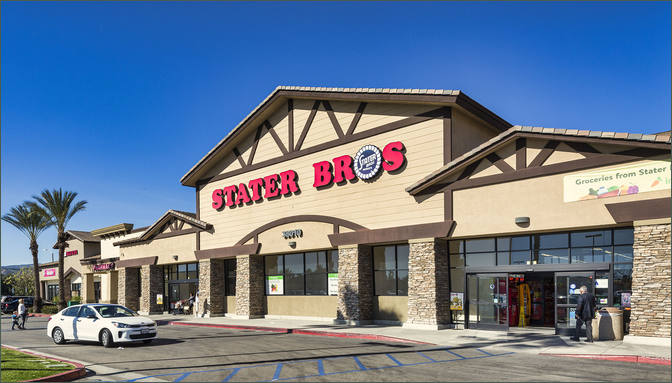
Sample of REIT’s Properties. Image Source - REIT’s website
REIT Simulation
Below is a simulation of how much money you would have made in dividends, and how much the shares would be worth had you purchased them 1 year ago for the amounts below.
| With $1,000 USD | With $500 USD | With $250 USD | With $100 USD | With $50 USD | |
|---|---|---|---|---|---|
| Initial investment | @ $27.57 per share you would have been able to buy 36 shares of IVT on 2025-07-31 costing $992.52 | @ $27.57 per share you would have been able to buy 18 shares of IVT on 2025-07-31 costing $496.26 | @ $27.57 per share you would have been able to buy 9 shares of IVT on 2025-07-31 costing $248.13 | @ $27.57 per share you would have been able to buy 3 shares of IVT on 2025-07-31 costing $82.71 | @ $27.57 per share you would have been able to buy 1 shares of IVT on 2025-07-31 costing $27.57 |
| Current worth | On 2026-07-30 these 36 shares would be worth $1,266.48 @ $35.18 | On 2026-07-30 these 18 shares would be worth $633.24 @ $35.18 | On 2026-07-30 these 9 shares would be worth $316.62 @ $35.18 | On 2026-07-30 these 3 shares would be worth $105.54 @ $35.18 | On 2026-07-30 these 1 shares would be worth $35.18 @ $35.18 |
| Dividends earned | $35.11 in dividends would have been earned since 2025-07-31 with 36 shares. | $18 in dividends would have been earned since 2025-07-31 with 18 shares. | $8.78 in dividends would have been earned since 2025-07-31 with 9 shares. | $2.93 in dividends would have been earned since 2025-07-31 with 3 shares. | $0.98 in dividends would have been earned since 2025-07-31 with 18 shares. |
| Net (gain / loss)* | 309.07 USD | 154.54 USD | 77.27 USD | 25.76 USD | 8.59 USD |
| ROI** | 31.14% | 31.14% | 31.14% | 31.14% | 31.14% |
*Net (Gains/Loss): Includes the stock price (appreciate or depreciate ) + dividends earned during period held. Stock prices based on closing price for the date. **ROI: Is based on the Net (gain/loss) divided by the initial investment value. Note: Past performance is no guarantee of future results. This is a high-level simulation and does not account for many factors such as inflation and taxes so we cannot guarantee the accuracy of this simulation.
REITRating™ Scorecard
Compare with other REITs | See the complete trend
| Rating | Dividend Section | Avg. Rating |
|---|---|---|
| 8 | Dividend Payment Growth: Analysis of how the REIT’s dividend payments have performed during the last three years. | 4.3 |
| 5 | Dividend Payment Consistency: Analysis of how many periods the REIT’s dividends have been paid consistently without a gap in payment. | 8.1 |
| Rating | AFFO & Efficiency Section | Avg. Rating |
| 10 | Operating Expense Efficiency: Analysis of the REIT's Operating Expenses to its Revenues. | 9.7 |
| 10 | Operating Expense Efficiency Trend: Analysis of the trend of the REIT's Operating Expenses to its Revenue. | 8.6 |
| Rating | Leverage Section | Avg. Rating |
| 9 | Debt Leverage Health: Analysis of the REIT’s Total Debt to Total Assets. | 5.0 |
| 9 | Debt Leverage Health Trend: Analysis of the REIT’s Total Debt to Total Assets over the last two years. | 6.7 |
| Rating | Asset & Revenue Section | Avg. Rating |
| 6 | G&A Effeciency Level: Analysis of the REIT’s General and Administrative expenses in relationship to its Revenues. | 6.7 |
| 8 | G&A Effeciency Trend: Analysis of the Trend of the REIT’s General and Administrative expenses in relationship to its Revenues. | 7.3 |
| 9 | Revenues Growth: Analysis of how the REIT's Revenue has performed over the last two years. | 6.9 |
| 9 | Total Asset Growth: Analysis of how the REIT has grown its Total Assets over the last two years. | 6.3 |
| Rating | Properties Section | Avg. Rating |
| Rating | Market Cap Section | Avg. Rating |
| 4 | Market Cap Strength: Analysis of the REIT's Market Capitalization performance, preservation and resistance in comparison to market changes. | 5.3 |
| 4.8 | Overall REITRating™ Score (See trend) | 5.2 |
REITRating is REITNote's Real Estate Investment Trust industry-specific rating and ranking system. The REIT’s score for each analysis is out of ten points, with ten being the best score and zero being the worst. A score of zero can be assigned if the REIT does not meet the criteria for that specific analysis. N/A is assigned if insufficient data is available for a particular analysis. Our REITRating logic is continuously improving, so a REIT’s rating and ranking may change over time. Important Note: REITRating is not a predictor of a REIT’s future performance, it is an evaluation of its past results. Additionally, the REITRating system is for informational purposes only and does not represent financial or investment advice or a recommendation of which REITs to acquire. Learn more.
REITProperty
| Name | Type | Address | City | State |
|---|---|---|---|---|
| Antoine Town Center | Retail | 12430 Tomball Pkwy | Houston | TX |
| Bay Colony Town Center | Retail | 2955 S Gulf Freeway | League City | TX |
| Bay Landing | Retail | 27251 Bay Landing | Bonita Springs | FL |
Related REITs
| REIT | REITRating™ Score | Exchange | Market Capitalization | Sector | Country |
|---|---|---|---|---|---|
| Acadia Realty Trust (AKR) | 7.8 | NYSE | Mid-Cap | Retail | United States |
| Agree Realty Corp. (ADC) | 7.8 | NYSE | Mid-Cap | Retail | United States |
| Brixmor Property Group, Inc. (BRX) | 6.4 | NYSE | Mid-Cap | Retail | United States |
| Broadstone Net Lease, Inc. (BNL) | 7.8 | NYSE | Mid-Cap | Industrial Health Care Office Retail | United States |
| Curbline Properties (CURB) | 2.0 | NYSE | Mid-Cap | Retail | United States |
Last updated: 2026-07-31 - v7.2.2